Mapping Racial Violence in America
The Racial Violence Archive (RVA) documents historical racial violence to support research, teaching, and remedial efforts related to these histories and legacies today. The map below displays incomplete and ongoing counts of race-related political violence for select counties in the United States, focusing on anti-Black violence in the period 1870 to 1970 within states where RVA data collection has progressed to date.
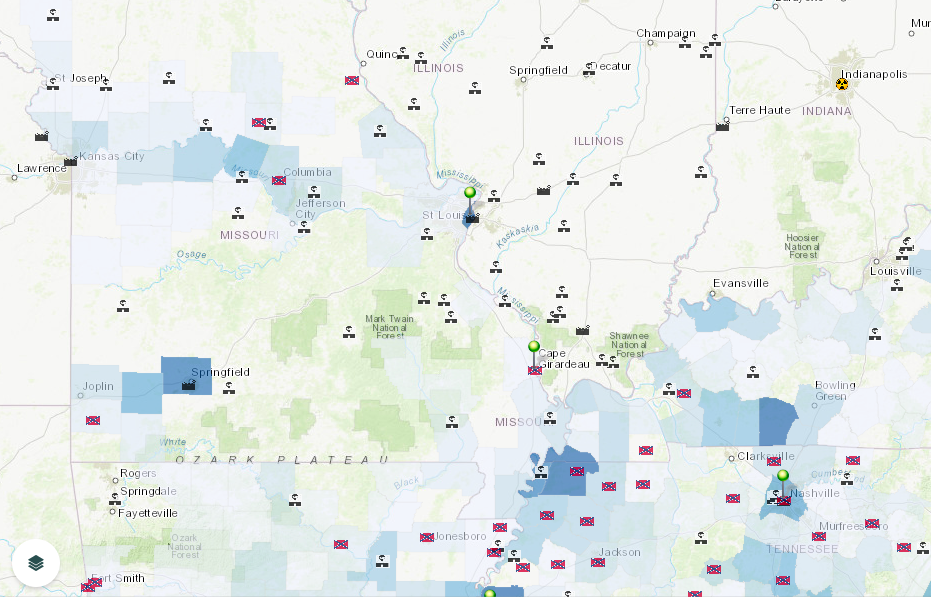
Recorded Incidence of Racial Violence by County
Note: Racial Violence Archive maps do not present total counts of events of racial violence in the history of the United States. A truly comprehensive account is unattainable given limits of the historical record, including the suppression of this record, and the ubiquitous forms of racist violence (structural, cultural, and direct), some of which cannot be reliably quantified or represented spatially.
As Equal Justice Initiative (2020) writes of its related data visualizations, mapping racial violence inevitably "represents a minimum rather than a maximum. Because records are scattered and incomplete, the lack of documentation of violence in a particular county does not mean that Black people in those counties were not targeted for whippings, shootings, rapes, lynchings, and other acts of racial violence." For a detailed discussion of challenges in documenting racial violence read, "Documenting Reconstruction Violence: Known and Unknown Horrors," in Equal Justice Initiative, “Reconstruction in America: Racial Violence after the Civil War, 1865-1876” (2020).
Within these constraints, Racial Violence Archive maps share aggregated records from our database to support urgent research, teaching, and engagement with these histories and legacies. Racial Violence Archive data are obtained from related databases (e.g., lynching data), published works (e.g., government reports and scholarship), and our own archival research, all of which is ongoing. Shading represents the intensity of historical racial violence within a county. County data for additional states will become viewable as data collection progresses.